Entering Progress (%) and Monitoring Project Status
Visualizing the Current Completion Status of Tasks
Just as important as planning a schedule is tracking 'how much of the current work has been completed compared to the plan?'. Rudia Online Gantt provides an intuitive progress fill effect inside each task bar, helping leaders monitor the project's health at a glance.
The progress, expressed as a number from 0% to 100%, is visualized as a darker or solid color filling up inside the brightly colored bar on the timeline. At 50%, half the bar is filled; at 100%, the entire bar is solidly filled.
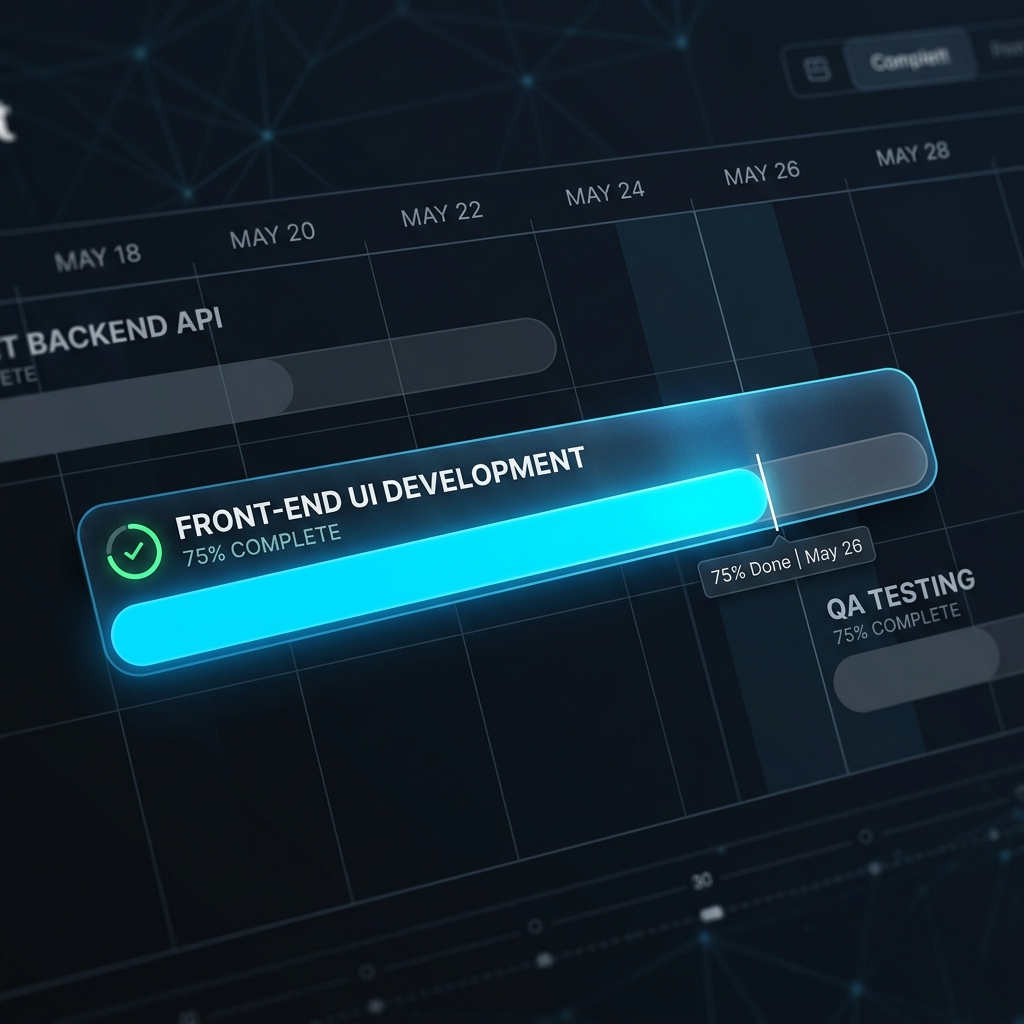
[Figure 6] Progress bar UI that intuitively shows the completion rate of a task
Two Ways to Enter Progress
Users can select a comfortable method to update task achievements as follows:
| Input Method | Detailed Description |
|---|---|
| Direct Input in Data Grid | Double-click the Progress (%) column in the left spreadsheet and directly type a number like '75' or '100'. Advantageous for updating large amounts of data. |
| Dragging Inside the Bar with Mouse | Grab the end of the progress fill line that appears inside the rendered bar on the timeline and drag it left or right. Intuitive and fast when adjusting a view for reporting. |
Automatic Progress Calculation for WBS Parent Groups (Weighted Roll-up)
If you have grouped child tasks into folders (parents) using the WBS hierarchy, the progress of the parent group cannot be arbitrarily entered by the user. Instead, a weighted average proportional to the Duration of the underlying child tasks is automatically calculated and reflected in the parent group.
For example, if a 1-day task is 100% complete and a 9-day task is 0% complete, the parent group's progress is not a simple average of 50%, but rather accurately calculated as 10% because the duration weight is applied. Thanks to this powerful algorithm, a project general manager can trust the precise overall completion rate of the project just by looking at the progress number of the top-most root node.